Exploratory Statistical Data Analysis with a Real Dataset And Pandas
Today we’ll leverage Python’s Pandas framework for Data Analysis, and Seaborn for Data Visualization.
As a geeky programmer with poor sense of aesthetics, I’ve found Seaborn to be an awesome visualization tool whenever I need to get a point accross.
It uses Matplotlib under the hood, but sets graphics up with default style values that make them look a lot prettier than I could ever manage to make them. We’ll take a look at a Dataset, and I’ll try to give you an intuition of how to look at different features. Who knows, maybe we’ll actually gain some insights from this!
Can’t Make an Omelette with no Eggs: The Dataset.
For this analysis I’m using the 120 years of olympics Dataset, which you can download or read more about by clicking the link.
I downloaded it for free from Kaggle, an awesome site if you need to get a Dataset to try out some new Machine Learning algorithm, brush up on some framework’s API, or just have a bit of fun.
I’ll only be using the ‘athlete_events’ CSV file, which has a row for every competitor on every Olympics game since 1900, with their country of birth, whether they obtained a medal, etc.
As an interesting fact, the medals column is 85% empty, so on average only about 15% of Omlympics Athletes actually get a medal. Add to that that some Athletes get more than one, and it shows how an even narrower quantity of the already few Olympic level athletes actually earn a medal. All the more credit to them!
Starting the Analysis: What’s the Dataset like?
First of all, before I try to glean any insights, I’d like to get a better intuition on what the Dataset’s like. How many of it’s data are missing? How many different columns are there? Those are the questions I like to start off from.
I’m using a Jupyter Notebook for this analysis, but I’ll be adding code snippets for every relevant line I run so you can follow along.
I made the Notebook available in this repository nonetheless, in case you want to take a peek yourself, and want a place to start from.
What I’ll do first is load the data with Pandas, and check its size.
import pandas as pd
import seaborn as sns

df = pd.read_csv('athlete_events.csv')
df.shape
#(271116, 15)
In this case, the Dataset has 15 different columns, and a whole 271116 rows! That’s over 270k athletes! I wonder how many different athletes there actually are, though. Also, how many of them actually won medals?
In order to check this, I’ll first list the Dataset’s rows calling the ‘list’ function on the Dataset. I see we have many interesting features.
list(df)
#['ID','Name','Sex','Age','Height','Weight','Team','NOC','Games','Year','Season','City',
# 'Sport','Event','Medal']
A few of the things I can think of here are, we could look at average height and weight for Olympics Athletes or divide them by sports. We could also see the distribution of both variables depending on Sex. We may even see how many Medals each country got as a time Series, and see the rise and fall of civilizations throughout the twentieth century.
The possibilities are endless! But first let’s tackle the difficult issues: how complete is our Dataset?
def NaN_percent(df, column_name):
    row_count = df[column_name].shape[0]
    empty_values = row_count - df[column_name].count()
    return (100.0*empty_values)/row_count
for i in list(df):
    print(i +': ' + str(NaN_percent(df,i))+'%')
'''
0% incomplete columns omitted for brevity.
Age: 3.49444518214%
Height: 22.193821095%
Weight: 23.191180159%
Medal: 85.3262072323% --Notice how 15% of athletes did not get any medals
'''
Using Pandas’ count method on a series, I can get the quantity of non-empty rows. However looking at the shape property, I can actually see the total quantity of rows, regardless of whether they’re empty or not.
After that it’s just a matter of substracting and dividing. We see only four columns are incomplete at all: Height, Weight, Age and Medal.
Medal is incomplete any time an athlete doesn’t actually win a medal, so it is to be expected for it to not be too full. However on the Weight, Height and Age fronts we’re pretty challenged.
I tried filtering the rows by different years, but the incompleteness seems to be consistent over time, which makes me think there may be a few countries that do not supply those data about their Athletes.
Starting our Actual Analysis: What’s the Deal with Medals?
The first question we asked about this domain was, how many different people actually won a medal since 1900? The following snippet answers that question:
total_rows = df.shape[0]
unique_athletes = len(df.Name.unique())
medal_winners = len(df[df.Medal.fillna('None')!='None'].Name.unique())

"{0} {1} {2}".format(total_rows, unique_athletes, medal_winners)

#'271116 134732 28202'
As you see, almost 135 thousand different people have competed on the Olympic games in the last 120 years, but only a little over 28 thousand have earned at least one medal.
That’s about one in five, which is not that bad. It’s not that optimistic once you consider many are actually competing in more than one category though.
Now that we’re at it, how many medals have actually been earned throughout these 120 years?
# See Medal distribution.
print(df[df.Medal.fillna('None')!='None'].Medal.value_counts())
# How many total medals.
df[df.Medal.fillna('None')!='None'].shape[0]
'''
Gold      13372
Bronze    13295
Silver    13116
Total: 39783
'''
Unsurprisingly, the Medal distribution is almost uniform: Almost the same quantity of gold, silver and bronze medals have been earned.
However, a total of almost 39 thousand medals have been awarded, which means if you belong to that top 20% of athletes that earn any medals, you’re expected to earn more than one on average.
What about distribution by countries? To obtain this, we’ll run the following snippets:
team_medal_count = df.groupby(['Team','Medal']).Medal.agg('count')
# order them by quantity
team_medal_count = team_medal_count.reset_index(name='count').sort_values(['count'], ascending=False)
#team_medal_count.head(40) to show the first rows

def get_country_stats(country):
    return team_medal_count[team_medal_count.Team==country]
# get_country_stats('some_country') to get that country's medals
Using that function, we could get the amount of medals of each type a certain country got, whereas by fetching the head of the Pandas DataFrame we may see the countries with the most medals.
Interestingly, the second country to ever earn more medals is still the Soviet Union, even though it hasn’t been around for almost 20 years.
First spot is for the USA -in all categories-, and third spot is for Germany. I also looked into Argentina and Croatia, my two nations, and was surprised to see Croatia has already earned 58 gold medals, even though it has only been around since 1991 (that’s 1992 in Olympics’ years).
Finding a script to get the different years on which a country participated of the Olympics will be left as an exercise for the reader — I bet you can do this!
Female Participation
Another interesting thing I thought of was, what was female representation like in the Olympics throughout the century? This snippet answered the question:
unique_women = len(df[df.Sex=='F'].Name.unique())
unique_men = len(df[df.Sex=='M'].Name.unique())
women_medals = df[df.Sex=='F'].Medal.count()
men_medals = df[df.Sex=='M'].Medal.count()

print("{} {} {} {} ".format(unique_women, unique_men, women_medals, men_medals ))

df[df.Sex=='F'].Year.min()

#33808 100979 11253 28530
#1900
I was surprised to see women participated in the games even since as early as 1900. However, historically there have been three men in the Olympics for every one woman. Surprised by women’s participation in the games in 1900, I decided to check their numbers throughout time. I finally used Seaborn!
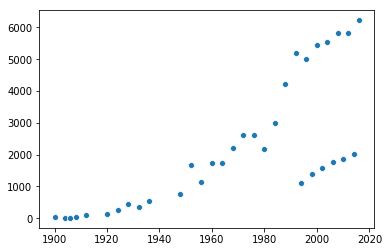
We can see female participation has been ramping up very fast these past few decades, starting from almost zero and reaching the thousands. However, are they actually growing in participation faster than men? Or is this just a matter of world population? To solve that, I made this second graph:
f_year_count = df[df.Sex=='F'].groupby('Year').agg('count').Name
m_year_count = df[df.Sex=='M'].groupby('Year').agg('count').Name
(sns.scatterplot(data= m_year_count),
 sns.scatterplot(data =f_year_count))
 vs male (Blue) over time.")
This time we can clearly see how a pattern emerges: women are actually approaching men in sheer numbers! Another funny thing emerges here: see those little dots below, to the right? I think those are the Winter Olympics! Anyway, the picture looks pretty optimistic for female representation, even though there hasn’t been a single year with more female participants than male yet.
Miscellaneae Analysis: Height and Weight
I spent a long while looking at height and weight graphs, but didn’t glean any interesting conclusions.
- Both are clearly normally distributed for most sports
- Men are consistently heavier and taller than women in all sports I checked
- the only interesting variation seems to be how far apart a gender falls from another depending on the Sport.
If you have any interesting ideas about things you could analyse using Weight and Height, please let me know! I haven’t gone deep enough in grouping by each sport, so there might be some insights to be gained there. That was all for today, I hope you found this analysis interesting, or at least you learned a bit about Pandas or Data Analysis.
I made the notebook available on GitHub so you can fork the project, do your own analysis and then do a pull request.
Of course you can take all the credit! Hopefully you’ll be better than I with graphs and visuals.
30s ad
☞ Python Network Programming - Part 1: Build 7 Python Apps
☞ Deep Learning Prerequisites: Logistic Regression in Python
☞ Automate the Boring Stuff with Python Programming
☞ Introduction To Python for beginners
Suggest:
☞ Python Tutorial for Data Science
☞ Learn Python in 12 Hours | Python Tutorial For Beginners
☞ Complete Python Tutorial for Beginners (2019)
☞ Python Tutorials for Beginners - Learn Python Online
☞ Python Programming Tutorial | Full Python Course for Beginners 2019