Understanding the Node.js Event Loop

Node.js is an event-based platform. This means that everything that happens in Node is the reaction to an event. A transaction passing through Node traverses a cascade of callbacks.
Abstracted away from the developer, this is all handled by a library called libuv which provides a mechanism called an event loop.
This event loop is maybe the most misunderstood concept of the platform.
I work for Dynatrace, a performance monitoring vendor and when we approached the topic of event loop monitoring, we put a lot of effort into properly understanding what we are actually measuring.
In this article I will cover our learnings about how the event loop really works and how to monitor it properly.
Common misconceptions
Libuv is the library that provides the event loop to Node.js. In his awesome keynote talk at Node Interactive Bert Belder, one of the key people behind libuv, started with presenting a Google image search that showed a variety of different approaches people had taken to picture the event loop and his disillusioning resume was that most of them were wrong.
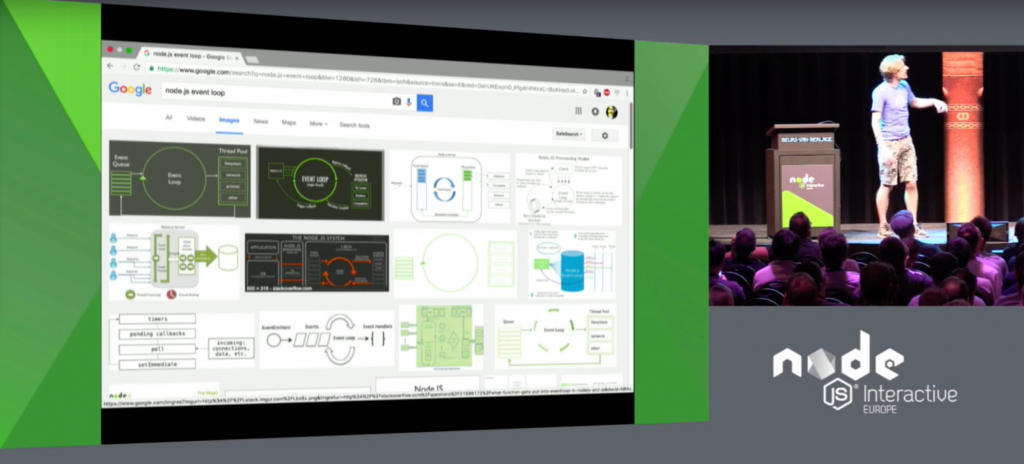
Let me cover the (my) most popular misunderstandings.
Misconception 1: The event loop runs in a separate thread than the user code
Misconception
There is a main thread where the JavaScript code of the user (userland code) runs in and another one that runs the event loop. Every time an asynchronous operation takes place, the main thread will hand over the work to the event loop thread and once it is done, the event loop thread will ping the main thread to execute a callback.
Reality
There is only one thread that executes JavaScript code and this is the thread where the event loop is running. The execution of callbacks (know that every userland code in a running Node.js application is a callback) is done by the event loop. We will cover that in depth a bit later.
Misconception 2: Everything that’s asynchronous is handled by a thread pool
Misconception
Asynchronous operations, like working with the filesystems, doing outbound HTTP requests or talking to databases are always loaded off to a thread pool provided by libuv.
Reality
Libuv by default creates a thread pool with four threads to offload asynchronous work to. Today’s operating systems already provide asynchronous interfaces for many I/O tasks (e.g. AIO on Linux).
Whenever possible, libuv will use those asynchronous interfaces, avoiding usage of the thread pool. The same applies to third party subsystems like databases. Here the authors of the driver will rather use the asynchronous interface than utilizing a thread pool.
In short: Only if there is no other way, the thread pool will be used for asynchronous I/O.
Misconception 3: The event loop is something like a stack or queue
Misconception
The event loop continuously traverses a FIFO of asynchronous tasks and executes the callback when a task is completed.
Reality
While there are queue-like structures involved, the event loop does not run through and process a stack. The event loop as a process is a set of phases with specific tasks that are processed in a round-robin manner.
Understanding the phases of an event loop cycle
To really understand the event loop we have to understand which work is done in which phase. Hoping that Bert Belder would approve it, my approach to show how the event loop works would be as follows:

Let’s discuss those phases. An in-depth explanation can be found on the Node.js website.
Timers
Everything that was scheduled via setTimeout() or setInterval() will be processed here.
IO Callbacks
Here most of the callbacks will be processed. As all userland code in Node.js is basically in callbacks (e.g a callback to an incoming http request triggers a cascade of callbacks), this is the userland code.
IO Polling
Polls for new events to be processed on the next run.
Set Immediate
Runs all callbacks registered via setImmediate().
Close
Here all on(‘close’) event callbacks are processed.
Monitoring the Event Loop
We see that in fact everything that goes on in a Node applications runs through the event loop. This means that if we could get metrics out of it, they should give us valuable information about the overall health and performance of an application.
There is no API to fetch runtime metrics from the event loop and as such each monitoring tool provides their own metrics. Let’s see what we came up with.
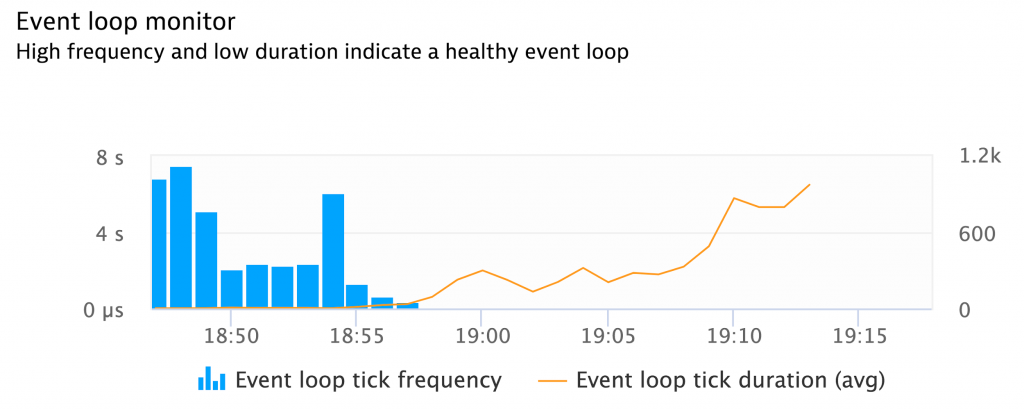
Tick Frequency
The number of ticks per time.
Tick Duration
The time one tick takes.
As our agent runs as a native module it was relatively easy for us to add probes to provide us this information.
Tick frequency and tick duration metrics in action.
When we did our first tests under different loads, the results were surprising — let me show you an example:
In the following scenario I am calling an express.js application that does an outbound call to another http server.
There are four scenarios:
- Idle
There are no incoming requests - ab -c 5
Using apache bench I created 5 concurrent requests at a time - ab -c 10
10 concurrent at a time - ab -c 10 (slow backend)
The http server that is called returns data after 1s to simulate a slow backend. This should cause something called back pressure as requests waiting for the backend to return pile up inside Node.
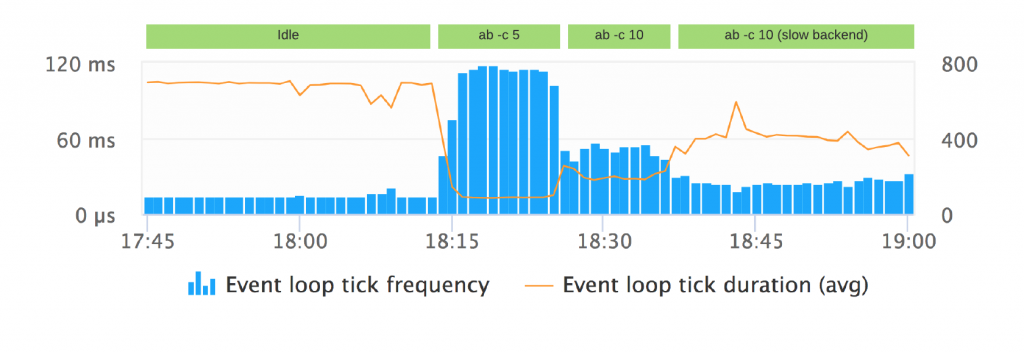
If we look at the resulting chart we can make an interesting observation:
Event loop duration and frequency are dynamically adapted
If the application is idle, which means that there are no pendings tasks (Timers, callbacks, etc), it would not make sense to run through the phases with full speed, so the event loop will adapt to that and block for a while in the polling phase to wait for new external events coming in.
This also means, that the metrics under no load are similar (low frequency, high duration) to an application that talks to a slow backend under high load.
We also see that this demo application runs ‘best’ in the scenario with 5 simultaneous requests.
Consequently tick frequency and tick duration need to be baselined factoring in the current requests per second.
While this data already provides us with some valuable insights, we still don’t know in which phase the time is spent and so we researched further and came up with two more metrics.
Work processed latency
This metric measures how long it takes until an asynchronous task gets processed by the thread pool.
High work processed latency indicates a busy/exhausted threadpool.
To test this metric I created an express route that processes an image using a module called Sharp. As image processing is expensive, Sharp utilizes the thread pool to accomplish that.
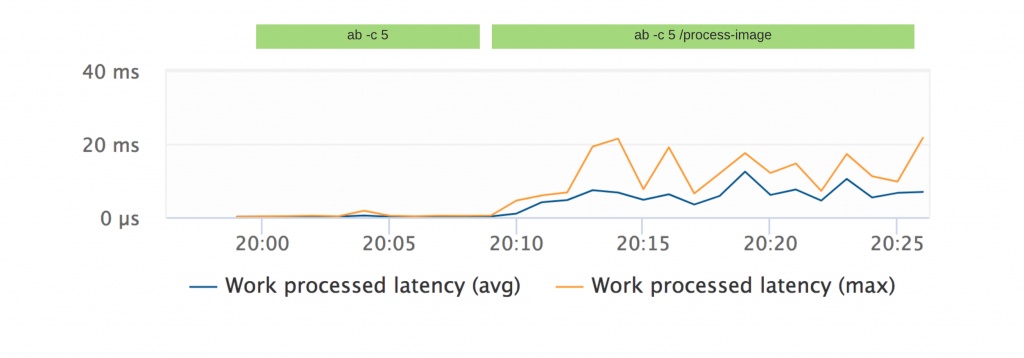
Running Apache bench with 5 concurrent connections against this a route with this image processing function reflects directly on this chart and can be clearly distinguished from a scenario of moderate load without the image processing in place.
Event Loop Latency
The event loop latency measures how long it additionally takes until a task scheduled with setTimeout(X) really gets processed.
A high event loop latency indicates an event loop busy with processing callbacks.
To test this metric, I created an express route that calculates fibonacci using a very inefficient algorithm.
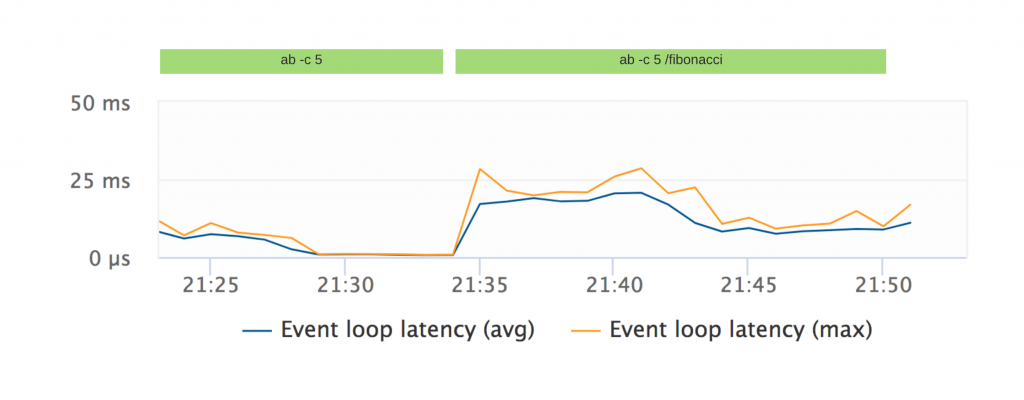
Running Apache bench with 5 concurrent connections against this a route with the fibonacci function shows that now the callback queue is busy.
We clearly see that those four metrics can provide us with valuable insights and help to understand the inner workings of Node.js better.
Still all of that needs to be seen in a bigger picture to make sense of it. Therefore we are currently collecting information to factor in these data into our anomaly detection.
Tuning the Event Loop
Of course, metrics alone do not help much without knowing how to derive possible actions to remedy problems from them. Here are a few hints on what to do when the event loop seems exhausted.
Utilize all CPUs
A Node.js application runs on a single thread. On multicore machines that means that the load isn’t distributed over all cores. Using the cluster module that comes with Node it’s easy to spawn a child process per CPU. Each child process maintains its own event loop and the master process transparently distributes the load between all childs.
Tune the Thread Pool
As mentioned, libuv will create a thread pool with the size of 4. The default size of the pool can be overridden by setting the environment variable UV_THREADPOOL_SIZE.
While this can solve load problems on I/O-bound applications I’d recommend excessive load testing as a larger thread pool might still exhaust the memory or the CPU.
Offload the work to Services
If Node.js spends too much time with CPU heavy operations, offloading work to services maybe even using another language that better suits a specific task might be a viable option.
Summary
Let’s summarize what we’ve learned in this post:
- The event loop is what keeps a Node.js application running
- Its functionality is often misunderstood — it is a set of phases that are traversed continuously with specific tasks for each phase
- There are no out-of-the-box metrics provided by the event loop so the metrics collected are different between APM vendors
- The metrics clearly provide valuable insights about bottlenecks but deep understanding of the event loop and also the code that is running is key
- In the future Dynatrace will add event loop telemetry to its root cause detection to correlate event loop anomalies with problems
For me there is no doubt that we just built the most comprehensive event loop monitoring solution on the market today, and I’m really happy that this amazing new feature will be rolled out to all of our customers within the next few weeks.
Credits
The stellar Node.js agent team at Dynatrace put a lot of effort into getting event loop monitoring right. Much of the findings presented in this blog post is based on their in-depth knowledge of the inner workings of Node.js. I’d like to thank Bernhard Liedl, Dominik Gruber, Gerhard Stöbich and Gernot Reisinger for all the work and support.
I hope this post did shed some light on the topic. Please follow me on twitter @dkhan. I’m happy to answer all your questions there or on the comment section below.
If you still want to learn more about the inner workings of the event loop and how to leverage them as a developer, I recommend this post by my friends at RisingStack.
If you want to give our Node.js monitoring a try, Download our free trial feel free to share your feedback with me anytime — this is how we learn.
30s ad
☞ Learn To Build An Elearning Website Using NodeJS
☞ Be a NodeJS expert from scratch
☞ The Complete NodeJS Course: Build a Full Business Rating App
☞ The Complete NodeJS Course: Build a Full Business Rating App
☞ Supreme NodeJS Course - For Beginners
Suggest:
☞ JavaScript Programming Tutorial Full Course for Beginners
☞ Learn JavaScript - Become a Zero to Hero
☞ Javascript Project Tutorial: Budget App
☞ E-Commerce JavaScript Tutorial - Shopping Cart from Scratch