Estimating The Favorite : Scraping Tweets using Python

Estimating The Favorite : Scraping Tweets using Python
Religious festival of all football followers — FIFA World Cup 2018,has just began in Russia.This month long prestigious sports bonanza will be celebrated across the globe till it’s mega finale scheduled on 15th July.
Seizing this opportunity, I have experimented my newly found skills to gauge who will be a crowd favorite among the two competing teams in an fixture.
Things you’ll learn here :
- How to scrape data from Twitter?
- Data Mining
Prerequisites :
- Tweepy library should be installed on your machine.
2. Access to Twitter. Make an account if you don’t have already.
Scraping textual data is an integral part of natural language processing.Twitter is very utilitarian platform when task in hand is analyzing sentiments.
Thought Process :

This is how the our approach will be — firstly, we will generate desired credentials to make use of Twitter API, then we will write a python code to extract live tweets, and in the end we will analyze the tweets by selecting pertinent keywords.
Let the fun begin…
Step-wise Guide for Scraping Tweets
A. Generating Credentials for Twitter API :
I. Visit https://apps.twitter.com/ and log in with your twitter credentials.
II. Click on “Create New App”
III. Enter necessary details and click “Create your Twitter application”
IV. On next page, click on “API keys” tab, and copy your “API key” and “API secret”. (Suggestion: Do make a sticky note on desktop of these credentials)
V. Scroll down and click “Create my access token”, and copy your “Access token” and “Access token secret”.
B. Connecting to Twitter API through Python code :
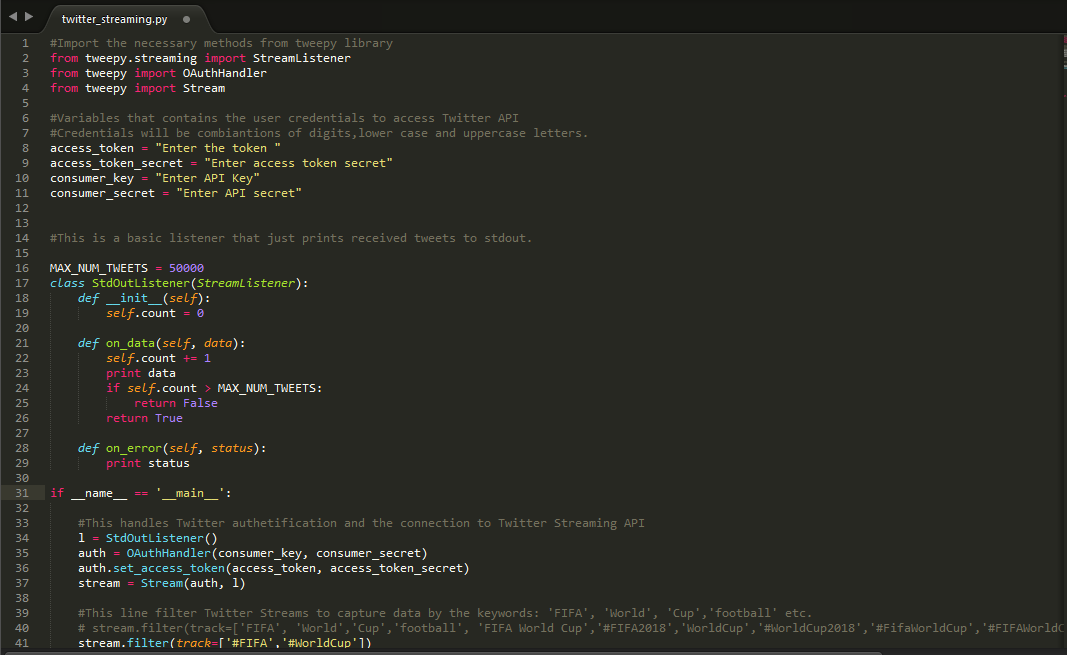
Below is the screenshot of code you need in order to connect to live streaming of tweets on Twitter and download them on your machine.
- Note: Python 2.7 version used while coding.
Once you execute the code on command prompt (for windows users), you’ll witness following data flow.

C. Analyzing Data :
Type below line to save downloaded tweets on command line.
python twitter_streaming.py > twitter_data.txt
To understand the direction of the polarity of the tournament opener, I ran the program for 2 days in regular intervals (on 13th and 14th June) to get a sizable and meaningful data sample. I could scrape text consisting 79,359 tweets of size is 450 MB in above mentioned time period.

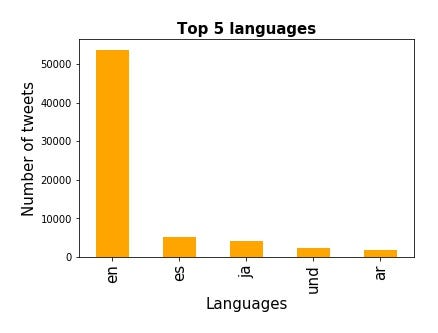
You can extract as many insights from the raw text as the business case demands. For example.Here is the one -Languages in which tweet was written.Find Jupyter notebook for this exercise in the bottom section.
Since first encounter was between host nation Russia and opponent was Saudi Arabia I selected following keywords.
- FIFA,World,Cup,football,FIFA World Cup,#FIFA2018
- WorldCup,#WorldCup2018,#FifaWorldCup,
- #FIFAWorldCup ,RUSKSA,#RUSKSA,prediction,win,#FIFA.
To estimate which one among these two is the favorite, targeted tweets with #RUS ,#KSA and #RUSKSA and segregated the result.
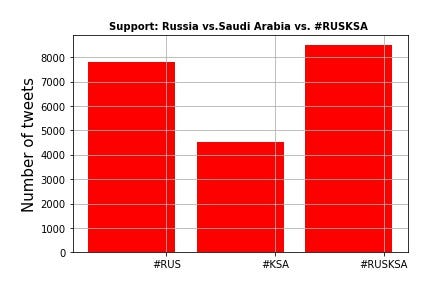
And surprisingly match result also turned out to be siding with popular public sentiment…!
Russia 5 — 0 Saudi Arabia
What a one sided affair !
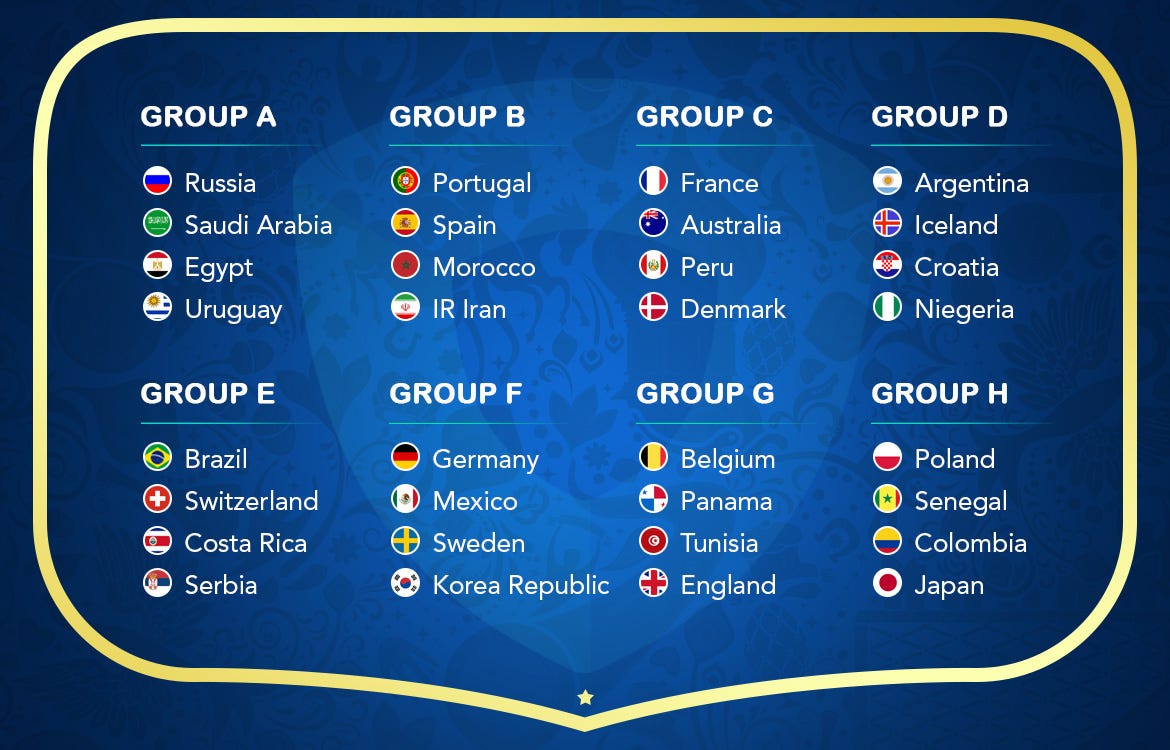
So what are you waiting for, there are 63 matches more to go. Have fun !! Down below is the infographic of teams participating in this edition of FIFA World Cup. Here you can find all fixtures all matches.
Jupyter Notebook :
Preliminaries
In [1]:
import json
import re
import pandas as pd
import matplotlib.pyplot as plt
Data Reading
In [2]:
tweets_data_path = 'twitter_data.txt'

tweets_data = []
tweets_file = open(tweets_data_path, "r")
for line in tweets_file:
    try:
        tweet = json.loads(line)
        tweets_data.append(tweet)
    except:
        continue
In [3]:
print ('Total Tweets Count:{}'.format(len(tweets_data)))
Total Tweets Count:79359
Structuring the raw data
In [4]:
tweets = pd.DataFrame()
tweets['text'] = map(lambda tweet:tweet['text'] if 'text' in tweet else ' ', tweets_data)
tweets['lang'] = map(lambda tweet: tweet.get('lang', None), tweets_data)
Drawing insights
In [5]:
tweets_by_lang = tweets['lang'].value_counts()

fig, ax = plt.subplots()
ax.tick_params(axis='x', labelsize=15)
ax.tick_params(axis='y', labelsize=10)
ax.set_xlabel('Languages', fontsize=15)
ax.set_ylabel('Number of tweets' , fontsize=15)
ax.set_title('Top 5 languages', fontsize=15, fontweight='bold')
tweets_by_lang[:5].plot(ax=ax, kind='bar', color='orange');
plt.savefig('top_5_langs.jpg',bbox_inches='tight', pad_inches=0.3)

Mining Tweets based on Keywords
In [6]:
def word_in_text(word, text):
    word = word.lower()
    text = text.lower()
    match = re.search(word, text)
    if match:
        return True
    return False
In [7]:
tweets['FIFA'] = tweets['text'].apply(lambda tweet: word_in_text('#FIFA', tweet))
tweets['WorldCup'] = tweets['text'].apply(lambda tweet: word_in_text('#WorldCup', tweet))
In [8]:
keywords = ['FIFA','WorldCup']
tweets_by_keywords = [tweets['FIFA'].value_counts()[True],tweets['WorldCup'].value_counts()[True]]
x = list(range(len(keywords)))
width = 0.8
fig, ax = plt.subplots()
plt.bar(x, tweets_by_keywords, width, alpha=1, color='g')

# Setting axis labels and ticks
ax.set_ylabel('Number of tweets', fontsize=15)
ax.set_title('Feed', fontsize=10, fontweight='bold')
ax.set_xticks([p + 0.4 * width for p in x])
ax.set_xticklabels(keywords, rotation=90)
plt.grid()
plt.tight_layout()
plt.savefig('selected_keywords.jpg',bbox_inches='tight', pad_inches=0.3)

In [9]:
#Counting Tweets
print ('Tweets with keyword FIFA: {}'.format(tweets['FIFA'].value_counts()[True]))
print ('Tweets with keyword WorldCup: {}'.format(tweets['WorldCup'].value_counts()[True]))
Tweets with keyword FIFA: 835
Tweets with keyword WorldCup: 9818
Note: Keywords used are:

FIFA,World,Cup,football,FIFA World Cup,#FIFA2018,WorldCup,#WorldCup2018,#FifaWorldCup,#FIFAWorldCup,RUSKSA,#RUSKSA,prediction,win,#FIFA.
Hence the total count is 79K+ .For simlplicity sake I have taken two keywords here.
Targeted Selection
In [10]:
#Selecting HashTags of corrosponding teams from the fixture
tweets['#RUS'] = tweets['text'].apply(lambda tweet: word_in_text('#RUS', tweet))
tweets['#KSA'] = tweets['text'].apply(lambda tweet: word_in_text('#KSA', tweet))
tweets['Neutral'] = tweets['text'].apply(lambda tweet: word_in_text('#RUS', tweet) or word_in_text('#KSA', tweet) or word_in_text('#RUSKSA', tweet))
In [11]:
keywords= ['#RUS','#KSA','#RUSKSA']
tweets_by_keywords = [tweets[tweets['Neutral'] == True]['#RUS'].value_counts()[True],
                      tweets[tweets['Neutral'] == True]['#KSA'].value_counts()[True],
                      tweets[tweets['Neutral'] == True]['Neutral'].value_counts()[True]]
x = list(range(len(keywords)))
width = 0.8
fig, ax = plt.subplots()
plt.bar(x, tweets_by_keywords, width,alpha=1,color='r')
ax.set_ylabel('Number of tweets', fontsize=15)
ax.set_title('Support: Russia vs.Saudi Arabia vs. #RUSKSA ', fontsize=10, fontweight='bold')
ax.set_xticks([p + 0.4 * width for p in x])
ax.set_xticklabels(keywords)
plt.grid()
plt.savefig('Twitter_feed.jpg',bbox_inches='tight', pad_inches=0.3)

In [12]:
#Counting Tweets
print ('Russian Supporters:{}'.format(tweets['#RUS'].value_counts()[True]))
print ('Saudi Supporters:{}'.format(tweets['#KSA'].value_counts()[True]))
print ('Neutral:{}'.format(tweets['Neutral'].value_counts()[True]))
Russian Supporters:7796
Saudi Supporters:4527
Neutral:8488
Hopefully you enjoyed this post.So shed your love and affection, it will be estimated on the basis of number of times you hit the clap icon . #SeeYouNextTime #Till Then #KeepLearningNewThings
Also do read my other blog posts —
- https://towardsdatascience.com/exploratory-data-analysis-8fc1cb20fd15
- https://towardsdatascience.com/k-means-clustering-identifying-f-r-i-e-n-d-s-in-the-world-of-strangers-695537505d
- https://towardsdatascience.com/decision-tree-data-scientists-magic-bullet-for-hamletian-dilemma-411e0121ba1e
References:
Recommended Courses:
Python Web Development
☞ http://bit.ly/2LG51do
Making Predictions with Data and Python
☞ http://bit.ly/2sNEV1a
The complete beginners guide to Python programming.
☞ http://bit.ly/2sOI4xC
Python with Oracle Database
☞ http://bit.ly/2JMHSsl
Suggest:
☞ Python Tutorial for Data Science
☞ Learn Python in 12 Hours | Python Tutorial For Beginners
☞ Complete Python Tutorial for Beginners (2019)
☞ Python Tutorials for Beginners - Learn Python Online
☞ Python Programming Tutorial | Full Python Course for Beginners 2019